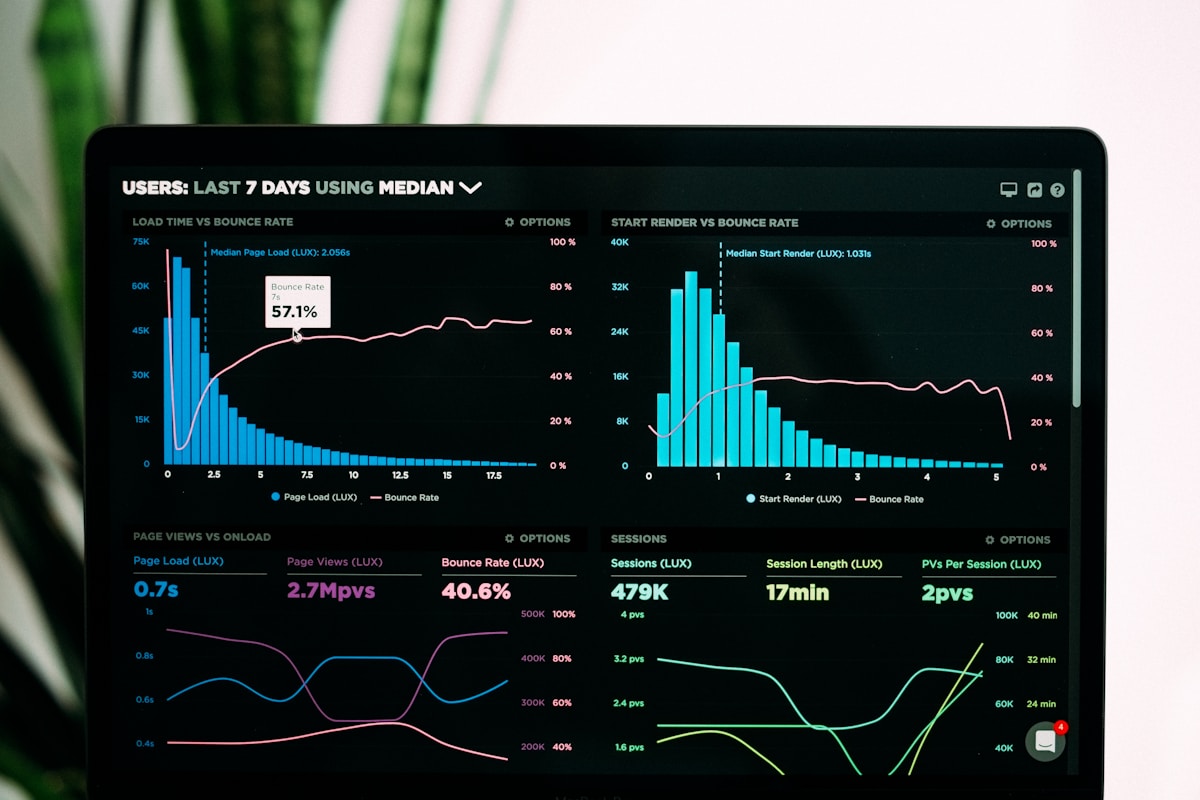
Data Visualization Made Simple
Transform Your Postgres Data Into Beautiful Dashboards
Connect your database in seconds and create stunning, interactive visualizations that help you make data-driven decisions faster.
Everything You Need to Visualize Data

Multiple Chart Types
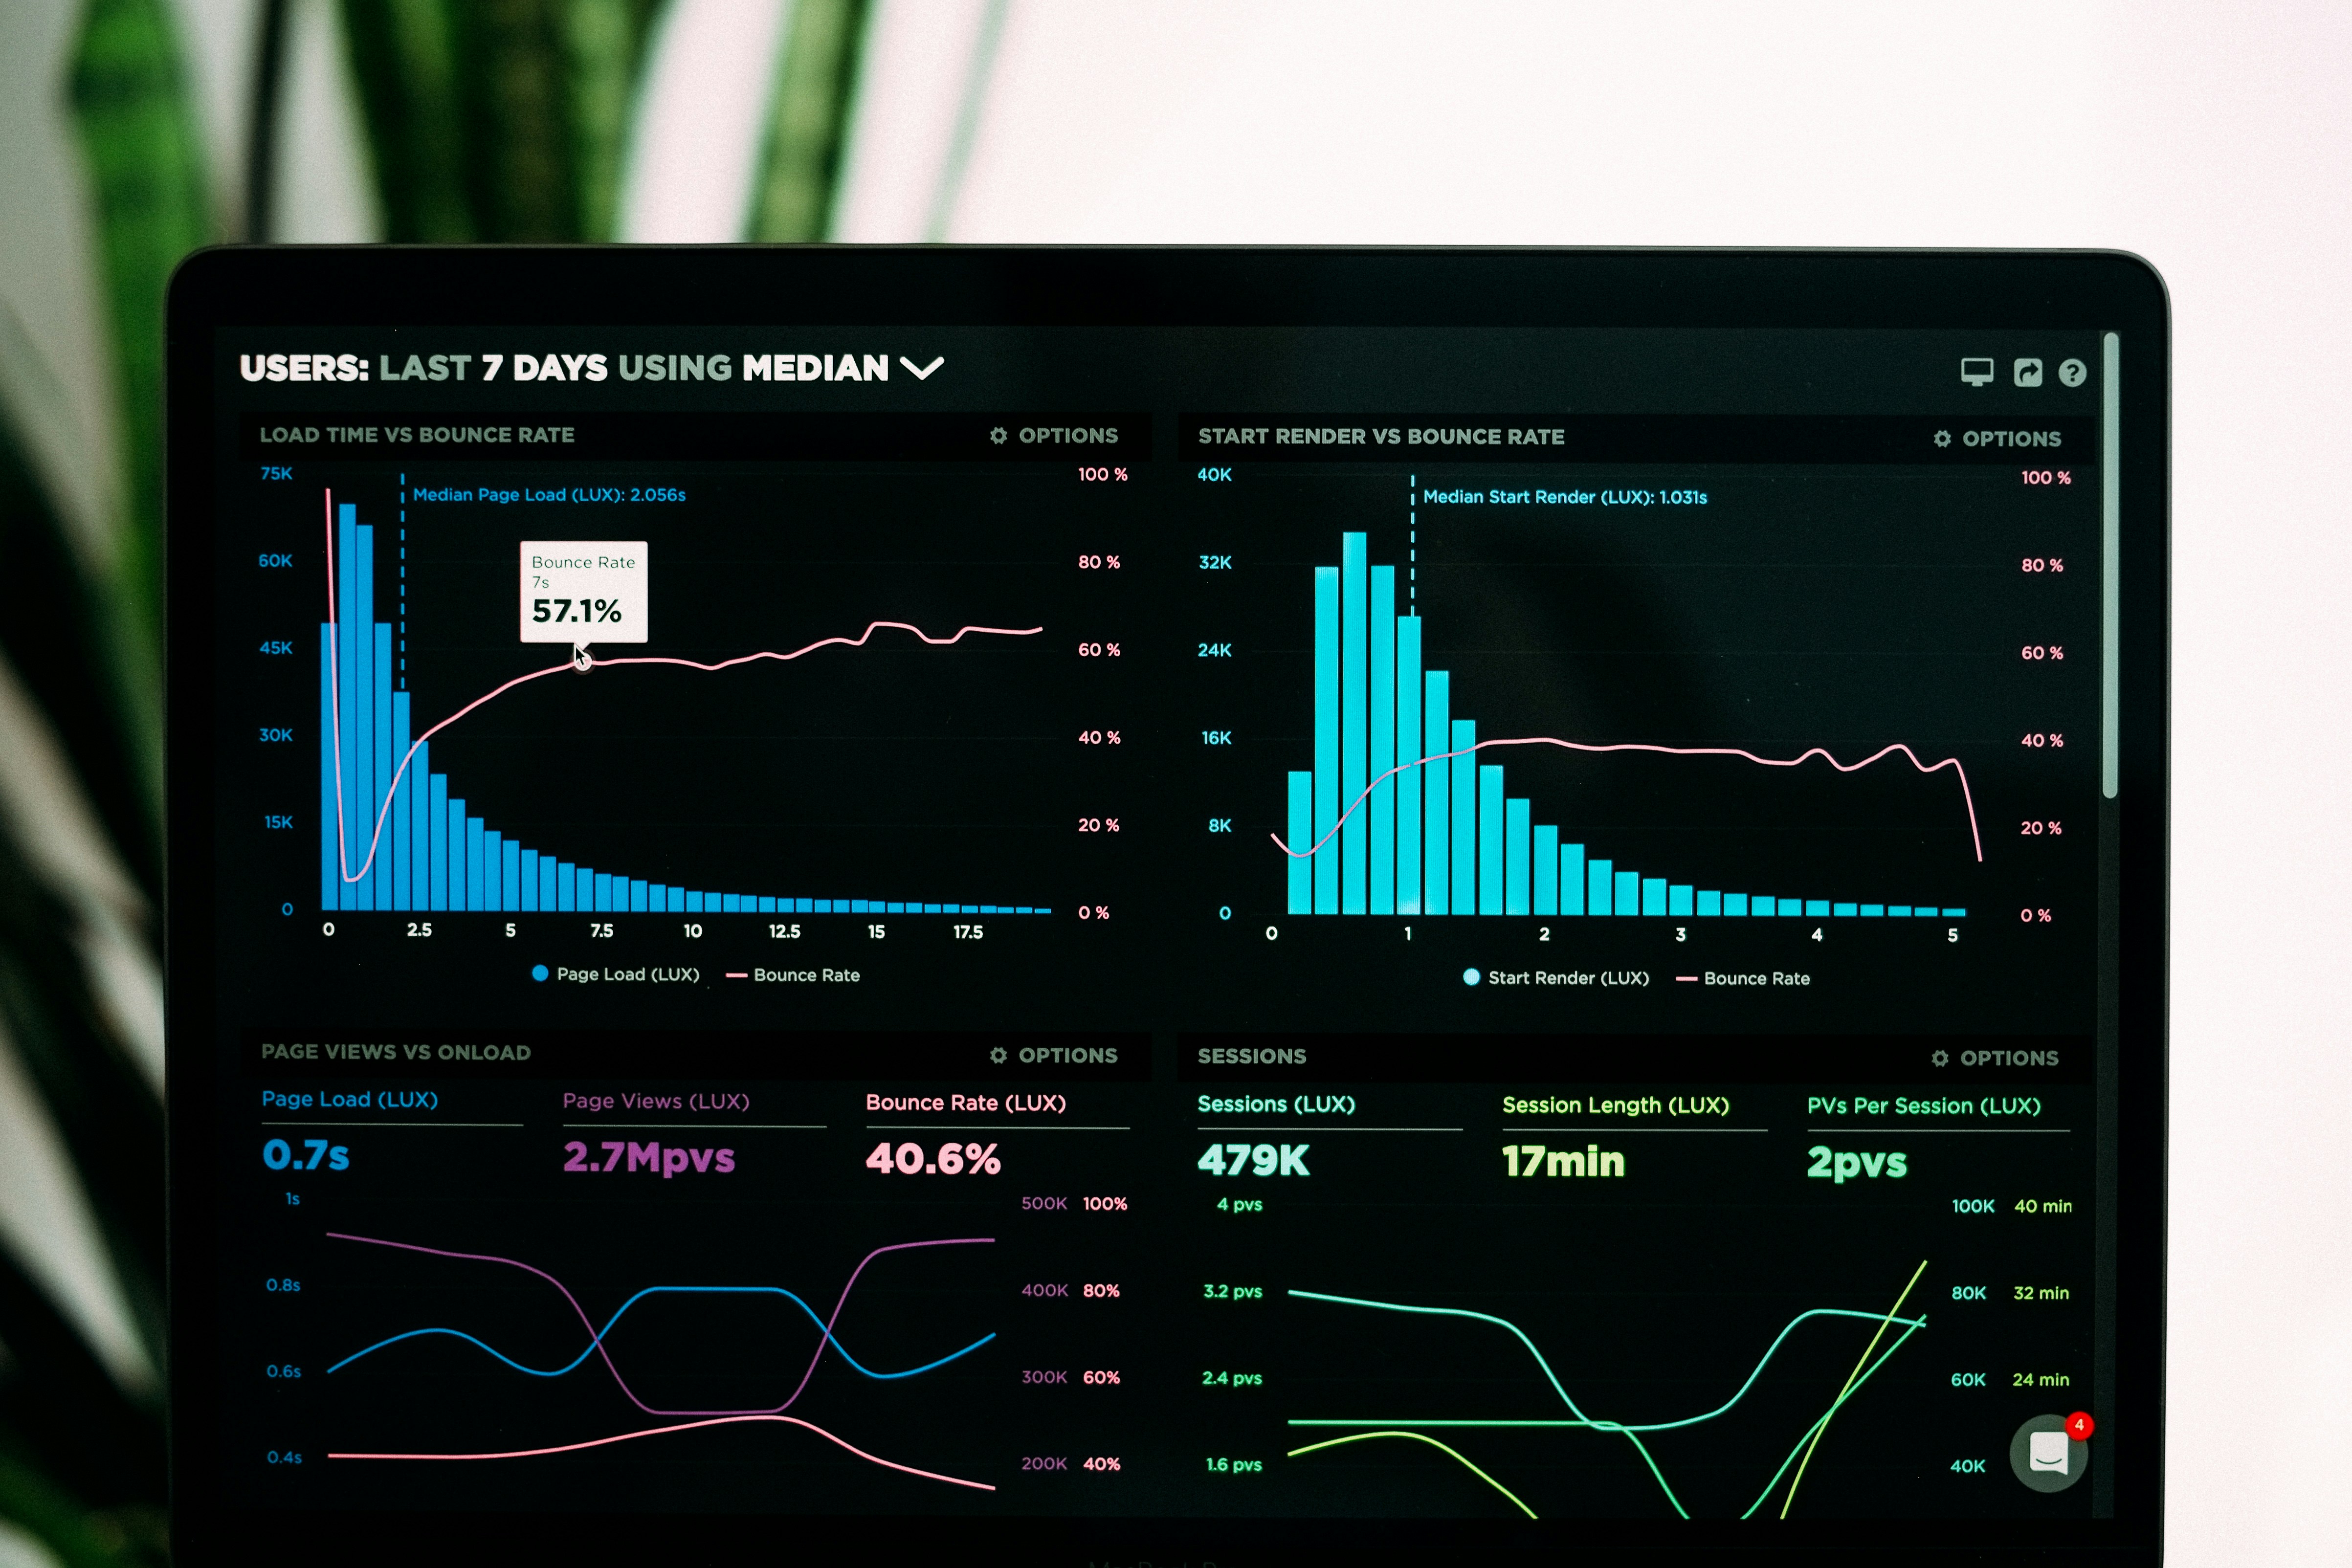
Choose from line charts, bar graphs, pie charts, scatter plots, heat maps, and more. Each chart type is optimized for different data patterns, helping you tell the right story with your data.
Custom Filters & Parameters
Add interactive filters to your dashboards so users can drill down into specific data segments. Date ranges, dropdown selectors, and search boxes make exploration intuitive and powerful.

Scheduled Reports
Automate your reporting workflow with scheduled email delivery. Set up daily, weekly, or monthly reports that are automatically generated and sent to stakeholders, keeping everyone informed without manual effort.

Role-Based Access Control
Secure your dashboards with granular permissions. Control who can view, edit, or share each dashboard. Perfect for organizations that need to protect sensitive data while enabling collaboration.

Export & Sharing
Share insights easily with PDF exports, embeddable widgets, and public links. Your dashboards look great whether viewed in the app, embedded in a website, or printed for meetings.

Mobile Responsive
Access your dashboards anywhere, on any device. Our responsive design ensures your visualizations look perfect on desktop, tablet, and mobile, so you can monitor your data on the go.
Powerful Visualization Tools
Watch your Postgres data come alive with dynamic charts, graphs, and tables that update in real-time. Our visualization engine automatically refreshes as your database changes, ensuring you always have the most current insights at your fingertips.
Create stunning dashboards without writing a single line of code. Our intuitive drag-and-drop interface lets you build custom visualizations in minutes. Choose from dozens of chart types, customize colors and layouts, and arrange widgets exactly how you want them.
Power users can leverage our advanced SQL editor with syntax highlighting, auto-completion, and query optimization suggestions. Write complex queries, save them as reusable templates, and visualize results instantly. Perfect for data analysts who need full control over their data exploration.


# Install Postgres Visualizer
npm install @postgres-visualizer/core

# Configure your database connection
const visualizer = new PostgresVisualizer({
  host: 'localhost',
  port: 5432,
  database: 'mydb',
  user: 'postgres',
  password: 'your-password'
});

# Create your first dashboard
const dashboard = visualizer.createDashboard({
  title: 'Sales Analytics',
  widgets: [
    {
      type: 'line-chart',
      query: 'SELECT date, revenue FROM sales ORDER BY date',
      title: 'Revenue Over Time'
    }
  ]
});

# Start the visualization server
visualizer.start(3000);
Seamless Postgres Integration
What Our Users Say
Postgres Visualizer transformed how our team works with data. We went from spending hours in spreadsheets to having beautiful, interactive dashboards that everyone can understand. The real-time updates are a game-changer for our operations.

The drag-and-drop builder is incredibly intuitive. I built my first dashboard in under 10 minutes, and it looked professional right out of the box. No more waiting on the engineering team for simple reports.

We evaluated several visualization tools, but Postgres Visualizer was the only one that handled our complex queries efficiently. The SQL editor is powerful, and the performance is outstanding even with millions of rows.

The scheduled reports feature has saved our team countless hours. Stakeholders get their weekly metrics automatically, and we can focus on deeper analysis instead of manual report generation.

Security was our top concern, and Postgres Visualizer delivered. The role-based access control lets us share dashboards confidently, knowing sensitive data is protected. It's enterprise-grade security with startup-level ease of use.

I love that I can access my dashboards on my phone. Whether I'm in a meeting or traveling, I always have our key metrics at my fingertips. The mobile experience is just as good as desktop.

Trusted by Data Teams Worldwide

TechFlow
Scaling Analytics for Rapid Growth

ShopHub
Real-Time Inventory Insights
FinanceCore
Regulatory Compliance Made Simple

HealthFirst
Patient Care Analytics

DevOps Pro
Engineering Metrics Dashboard

RetailMax
Customer Behavior Analysis

SecureBank
Risk Management Visualization

MedResearch Labs
Clinical Trial Data Tracking
Start Visualizing Your Postgres Data Today
Join thousands of data teams who have transformed their Postgres databases into powerful, interactive dashboards. Get started in minutes with our free trial—no credit card required. Experience the power of real-time visualization and make better decisions faster.